$ npm install
$ npm run build

$ node server.js$ node server_router.js디렉토리 구조
- src 밑에 있는 javascript 파일을 합쳐서 public 밑에 있는 bundle.js 파일로 번들링한다.
- express 로 server.js 를 구동하여 public/index.html 를 서비스 한다.
├─ public
│  ├─ bundle.js     : webpack 번들링 결과물 (index.js + mychart.js)
│  ├─ index.html    : express 서버의 디폴트 페이지
│  └─ js
│     ├─ chart.js
│     └─ jquery.js
│─ src
│  ├─ index.js      : webpack으로 번들링될 소스
│  └─ mychart.js    : webpack으로 번들링될 소스
│
├─ package.json       : npm 패키지 목록
├─ webpack.config.js  : webpack 설정
└─ server.js          : express 서버를 위한 router 파일
패키지 인스톨
npm install jquery
npm install chart.js
npm install express --save-dev
npm install webpack webpack-cli --save-dev
package.json
- `npm run dev` 명령어를 이용하여 development 모드로 번들링한다.
- `npm run build` 명령어를 이용하여 production 모드로 번들링한다.
{
  "name": "webpack_simple",
  "version": "1.0.0",
  "description": "",
  "main": "index.js",
  "scripts": {
    "dev": "webpack --mode development",
    "build": "webpack --mode production"
  },
  "keywords": [],
  "author": "",
  "license": "ISC",
  "devDependencies": {
    "webpack": "^5.88.2",
    "webpack-cli": "^5.1.4",
    "express": "^4.18.2"
  },
  "dependencies": {
    "chart.js": "^4.3.3",
    "jquery": "^3.7.0"
  }
}
webpack.config.js
- src / index.js 파일에서 시작하여 의존성 있는 파일들을 모두 포함하여 public / bundle.js 파일로 번들링한다.
const { resolve } = require('path')

module.exports = {
  entry: './src/index.js',
  output: {
    filename: 'bundle.js',
    path: resolve(__dirname, 'public')
  }
}
server.js
- TCP 3080포트를 bind하고, public 폴더를 기본 디렉토리로 해서 서비스를 시작한다.
- /data 폴더를 요청하면 json 데이터를 전송한다.
const express = require('express')
const app = express()

app.use(express.static('public'))

app.get('/data', (req,res) => {
    res.json({
            labels: ["HTML", "CSS", "JAVASCRIPT", "CHART.JS", "JQUERY", "BOOTSTRP"],
            datasets: [{
               label: "online tutorial subjects",
               data: [20, 40, 30, 35, 30, 20],
               backgroundColor: ['yellow', 'aqua', 'pink', 'lightgreen', 'lightblue', 'gold'],
               borderColor: ['black'],
               borderWidth: 2,
               pointRadius: 5,
            },{
               label: "online tutorial subjects",
               data: [10, 50, 20, 25, 40, 30],
               borderColor: ['red'],
               borderWidth: 2,
               pointRadius: 5,
            }],
         })
})

app.listen(3080, () => {
    console.log("서버가 실행됩니다.")
})
src / index.js
- 문서가 로딩되면 그래프를 그린다.
- mychart.js 플 포함하여 번들링 되도록 한다.
const MyChart = require('./mychart.js')

$(document).ready( () => {
     fetch(window.location.origin + "/data", {
        method: "get",
     })
     .then((response) => response.json())
     .then((data) => {
        console.log(data)
		MyChart.drawChart('chartId1','line',data)
		MyChart.drawChart('chartId','bar',data)
     })
})
src / mychart.js
- drawChart 함수를 export 하여 다른 곳에서 사용할 수 있도록 한다.
export const drawChart = function(id,type,data) {
    const chrt = document.getElementById(id).getContext("2d");
    return new Chart(chrt, {
        type: type,
        data: data,
        options: {
            responsive: false,
        },
    });
}
public / index.html
- bundle.js 를 포함하여 관련된 자바스크립트를 모두 포함시킨다.
<html>
<head>
   <meta charset- "UTF-8" />
   <title>chart.js</title>
   <script src="js/jquery.js"></script>
   <script src="js/chart.js"></script>
   <script src="bundle.js"></script>
</head>
<body>
   <canvas id="chartId1" aria-label="chart" heigth="350" width="580"></canvas>
   <canvas id="chartId" aria-label="chart" heigth="350" width="580"></canvas>
   <canvas id="chartId2" aria-label="chart" heigth="350" width="580"></canvas>

   <script>
     fetch(window.location.origin + "/data", {
        method: "get",
     })
     .then((response) => response.json())
     .then((data) => {
        console.log(data)
          const chrt = document.getElementById("chartId2").getContext("2d");
          const chartId = new Chart(chrt, {
            type: 'line',
            data: data,
            options: {
              responsive: false,
            },
          });
     })
   </script>
</body>
</html>
라우터를 이용하도록 server.js 를 다음과 같이 변경.
server_router.js
//import express from 'express'
const express = require('express')
const dataRouter = require('./routes/data')
const app = express()

app.use(express.static('public'))
app.use(express.json({ limit: '50mb'}))

app.use('/data', dataRouter)

app.listen(3080, () => {
    console.log("서버가 실행됩니다.")
})
routes / data.js
const express = require('express')

const router = express.Router()

const graph_data = {
	labels: ["HTML", "CSS", "JAVASCRIPT", "CHART.JS", "JQUERY", "BOOTSTRP"],
	datasets: [{
	   label: "color",
	   data: [20, 40, 30, 35, 30, 20],
	   backgroundColor: ['yellow', 'aqua', 'pink', 'lightgreen', 'lightblue', 'gold'],
	   borderColor: ['black'],
	   borderWidth: 2,
	   pointRadius: 5,
	},{
	   label: "grey",
	   data: [10, 50, 20, 25, 40, 30],
	   borderColor: ['red'],
	   borderWidth: 2,
	   pointRadius: 5,
	}],
}

router.get('/', (req,res) => {
    console.log(graph_data)
    res.json(graph_data)
})

module.exports = router
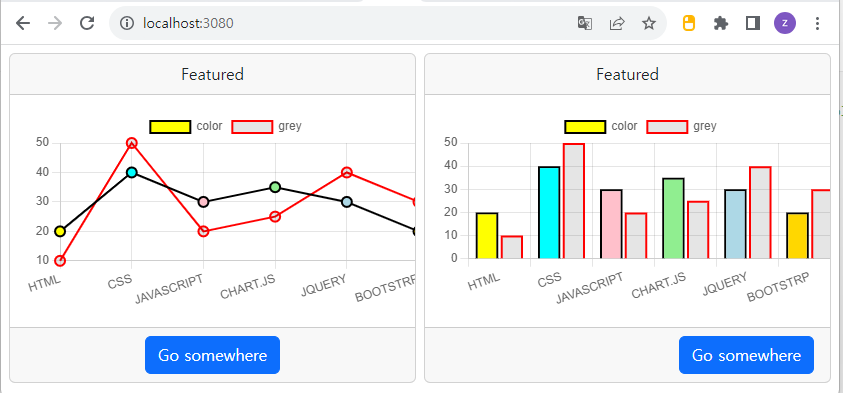
결과 화면
'Note' 카테고리의 다른 글
| simle and clean table (0) | 2023.08.13 |
|---|---|
| fastapi + jinja2 + webpack + chart.js + matplotlib (0) | 2023.08.12 |
| html에서 react 사용하기 (0) | 2023.08.05 |
| express + fetch + chart.js (0) | 2023.08.01 |
| express로 nodejs 웹서버 만들기 (0) | 2023.07.30 |